
share: 


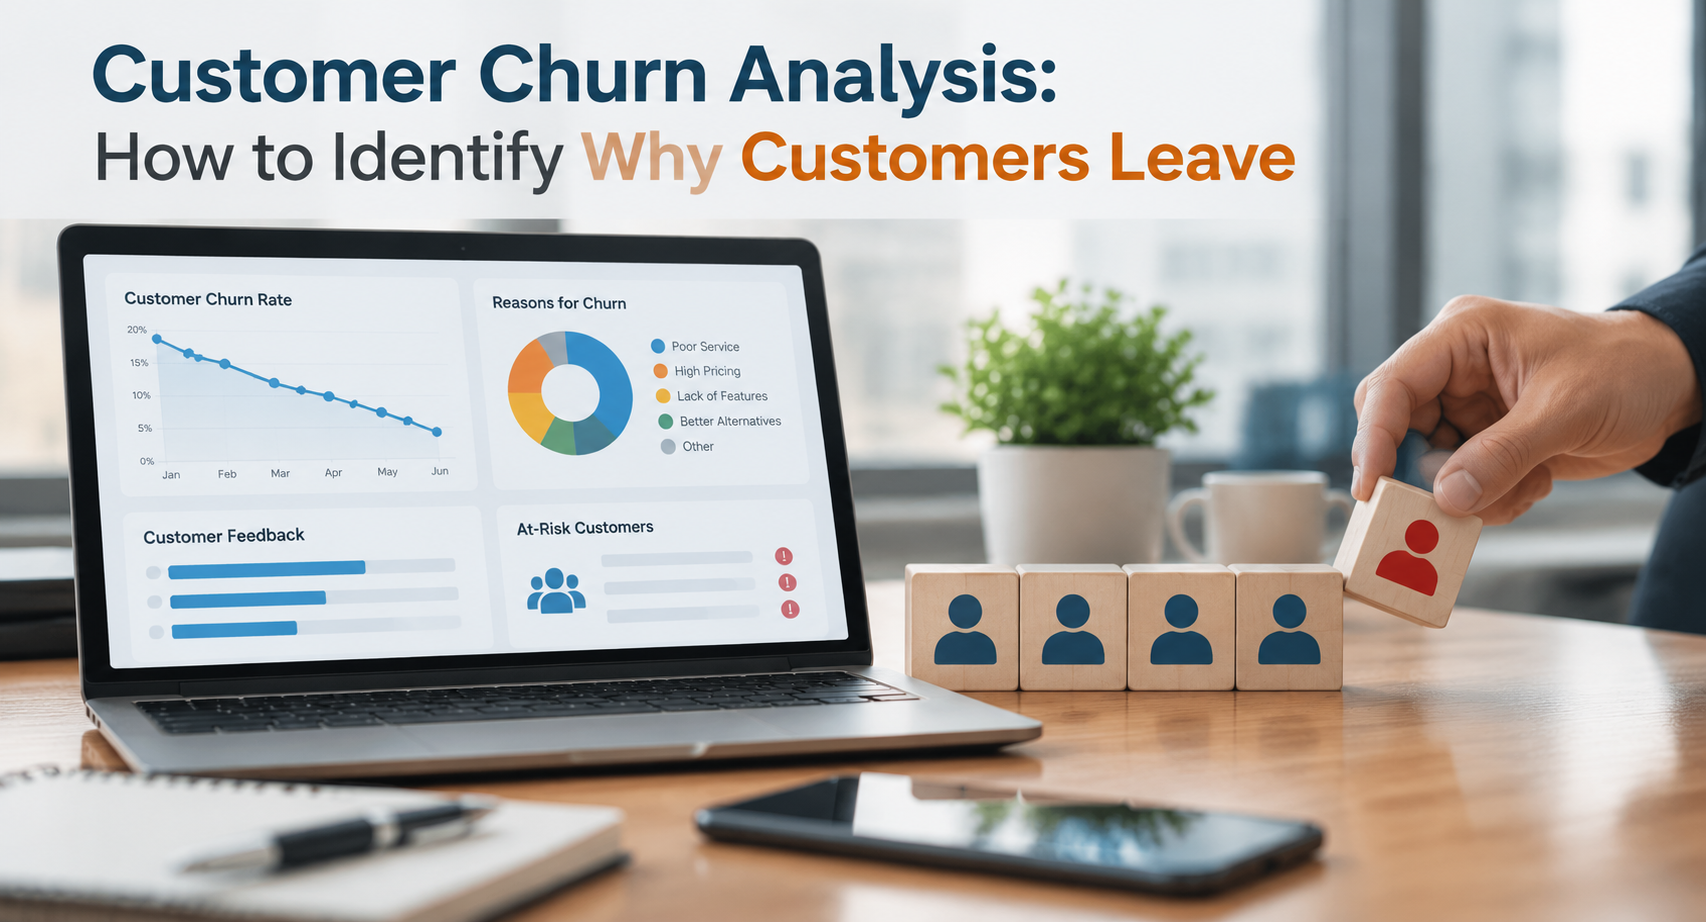
Customers rarely announce they are leaving. They go quiet, skip the renewal call, and vanish. While that silence is costly, it is also predictable. Most teams still learn about churn from a cancellation email. By then, the decision was made weeks ago.
Your CRM that already knows who is about to leave. Nobody has asked it yet. Teams that manage customer experience and success in Salesforce can spot the pattern and move the moment earlier.
This guide shows you which signals matter and how to act on them.
What Is Customer Churn Prediction, and Why Does It Matter?
Customer churn prediction uses customer data to estimate who is likely to leave, and when. Ita goal is simple: act before cancellation, not after.
Churn means a customer stops buying, renews late, or ends the relationship. Its signals fall into two camps: lagging indicators confirm the damage, while leading indicators warn you in time to act.
| Indicator type | Examples | Useful for |
|---|---|---|
| Lagging | Cancellations, non-renewals, final invoices | Measuring the loss |
| Leading | Falling usage, low survey scores, open escalations | Preventing the loss |
Bain & Company’s classic research, published in Harvard Business Review, found that companies can boost profits by almost 100% by retaining just 5% more of their customers. It also cited MBNA, whose annual defection rate was about half the industry average, and whose profits rose sixteenfold over eight years.
Although the study dates to 1990, the lesson still holds: loyalty compounds. SurveyVista’s customer feedback management software keeps survey scores right beside the account, so leading indicators are easy to see.
What Is the Difference Between Churn Analytics and Churn Prediction?
Customer churn analytics looks backward, while churn prediction looks forward. Analytics explains why customers left last quarter. Prediction flags who might leave next quarter. You need both.
How Do You Calculate Customer Churn Rate?
Churn rate equals customers lost divided by customers at the start, multiplied by 100. Start a month with 500 customers and end with 450, and you lost 50. That is a 10% churn rate.
Salesforce’s churn guide offers two helpful notes. Leave out customers who joined mid-period, because they distort the math. And cutting monthly churn from 3% to 2% can lift customer lifetime value by 50%.
What Types of Customer Attrition Can You Predict?
- Voluntary churn: the customer cancels or declines to renew.
- Involuntary churn: failed payments or expired cards end the account.
- Gradual disengagement: logins fade, meetings get skipped, replies slow down.
Why Do Customers Churn in the First Place?
Customers leave when the value they feel drops below the effort or cost they put in. It rarely happens overnight.
- A rough start. Onboarding drags, and the first win never arrives.
- Unsolved problems. The same issue comes back, and nobody owns it.
- A lost champion. The person who loved your product changes jobs.
- A better-looking option. A competitor promises more for less.
Many of these show up in your data first, which is why prediction works.
Which Signals Help You Predict Customer Churn?
Product usage, support activity, customer feedback, and contract data are the four sources of the best signals.
| Signal group | Warning signs | What it reveals |
|---|---|---|
| Product usage | Logins drop; key features go unused | What customers do |
| Support activity | Rising case volume; repeat issues; slow resolutions | Where friction lives |
| Customer feedback | Falling NPS, CSAT, or CES scores; negative comments | Why customers feel this way |
| Contract and billing | Renewal date nears; payments fail; plans downgrade | When risk peaks |
According to the American Customer Satisfaction Index, built at the University of Michigan, satisfaction drives complaints and loyalty, including customer retention. Unhappy customers complain more and stay less.
Here is the catch. Usage data shows what customers do, but it never explains why. Only feedback tells the reason, so customer churn analytics works best when behavior and feedback sit side by side.
Net Promoter Score (NPS) asks how likely customers are to recommend you, from 0 to 10. Customer satisfaction (CSAT) rates one interaction, and customer effort score (CES) measures how hard something was.
Which Survey Questions Help With Predicting Customer Churn?
Four short surveys cover most of the ground. Our customer lifecycle feedback guide shows where each one fits.
- Onboarding survey: ask about setup ease right after the final onboarding task.
- Post-case CSAT: send it when a support case closes.
- Relationship NPS: send it a set number of days before renewal.
- Exit survey: capture the reason when a customer cancels.
How to Predict Customer Churn: 6-Step Process
You can predict churn in six steps: define it, gather data, collect feedback, score accounts, test the score, and assign action. Most teams can run all six in about 30 days.
- Define churn plainly. Choose one rule, such as “no renewal” or “no login in 60 days.” Everything builds on it.
- Pull data into one place. Usage, support, billing, and feedback should connect to one customer record. Scattered spreadsheets hide patterns.
- Collect feedback at key moments. SurveyVista, built natively on Salesforce, sends surveys when lifecycle events occur. Response Mapping then saves answers to Contact, Case, Opportunity, or Account records. Our post on how to collect customer feedback that drives decisions walks through the setup.
- Build a health score. Weight each signal, then add up the points. The sample score below shows how. Start simple.
- Test it against history. Would last year’s churned accounts have been flagged? Adjust weights that missed.
- Assign an owner and an action. Low-score alerts notify the named owner. Escalation rules pass unanswered alerts to a manager after a set time.
Ready to start collecting churn signals? Use SurveyVista’s customer feedback survey template as a head start.
What Does a Simple Churn Score Look Like?
It looks like a short list of weighted warning signs that add up to 100. The weights below are illustrative. Tune them against your own history.
| Warning sign | Risk points |
|---|---|
| Latest NPS is 0–6 (detractor) | 30 |
| Usage down 20% or more month over month | 25 |
| Escalated support case still open | 20 |
| Main contact has left the company | 15 |
| Renewal is less than 60 days away | 10 |
Call anything above 50 “red.” Send it to the owner the same day.
What Mistakes Weaken Churn Prediction?
- Too many signals. A single low score can be a bad day, not a trend, and extra noise hides the pattern. Start with about five.
- No owner. An alert nobody owns is a dashboard decoration.
- Set and forget. Prices change, products change, and weights go stale.
Which Churn Prediction Model Should You Choose?
Start with the simplest model that works. For most teams, a rule-based health score works just fine. Machine learning pays off once you have enough churn history to learn from.
| Approach | Best for | Trade-off |
|---|---|---|
| Rule-based health score | Teams just starting out | Easy to explain; weights are manual judgment calls |
| Logistic regression | Teams with labeled history of churned and retained accounts | Clear and interpretable; can miss complex patterns |
| Tree-based models (random forest, gradient boosting) | Large volumes of account history | Often more accurate; harder to explain to stakeholders |
How Do You Know Your Churn Prediction Works?
Judge it by precision and recall, not accuracy alone. Precision shows how many flagged accounts truly churned. Recall shows how many churners you caught.
Accuracy misleads because churners are a small group. If 5% of customers leave, a model predicting “nobody leaves” scores 95% and helps no one.
What Does Predicting Customer Churn Look Like in Practice?
It looks like a short call that lands before the renewal does. This story is fictional, but you may know it.
A billing software company serves a regional distributor. The distributor’s quarterly NPS answer comes back a 6, and the comment says reports feel slow. Within a month, logins drop, the main contact leaves, and a support case closes with a low CSAT.
Three weak signals become one red score. The account owner calls the new contact, and a training session fixes the reporting problem. By renewal, a follow-up NPS shows a 9.
When Should You Use SurveyVista for Customer Churn Analytics?
Use SurveyVista when your customer data lives in Salesforce and you need the “why” behind churn signals. It fits best if:
- Accounts, cases, and renewals already live in Salesforce.
- You want surveys triggered by lifecycle events, not sent by hand.
- Low scores should alert owners automatically.
- You prefer records over spreadsheet exports.
SurveyVista is 100% native to Salesforce. No integration project is needed, and data stays inside Salesforce. Responses are not metered, so higher survey volume does not change your license.
SurveyVista Premium adds sentiment analysis for open-text answers using Amazon Comprehend, connected through your own AWS account. See how teams put SurveyVista to work in the customer case studies.
See churn risk before your customers leave. Book a SurveyVista demo or start a free trial and turn feedback into early warnings inside Salesforce.
Frequently Asked Questions
How far ahead can you predict customer churn?
Far enough to act: a practical target is 60 to 90 days before renewal, though your sales cycle should set the exact window. Shorter windows leave little time to fix real problems.
Can customer surveys alone predict churn?
No. Surveys capture opinions only from customers who respond, so quiet accounts can slip through. Pair scores with usage and support data for the full picture.
How often should you update your churn model?
Review it every quarter, and sooner after a pricing change, product launch, or new customer segment. Old weights go stale as customer behavior shifts.
What should you do after an account is flagged?
Reach out quickly with something specific, such as training or a fix for an open issue. Salesforce cautions that steep discounts can signal desperation and hurt margins. Then log the outcome.
What is a good churn rate?
It depends on your industry, price point, and contract length. Compare yourself with your own trend first.
More Like This



Rajesh Unadkat 
Founder and CEO
Rajesh is the visionary leader at the helm of SurveyVista. With a profound vision for the transformative potential of survey solutions, he founded the company in 2020. Rajesh's unwavering commitment to harnessing the power of data-driven insights has led to SurveyVista's rapid evolution as an industry leader.
Connect with Rajesh on LinkedIn to stay updated on the latest insights into the world of survey solutions for customer and employee experience management.