
share: 


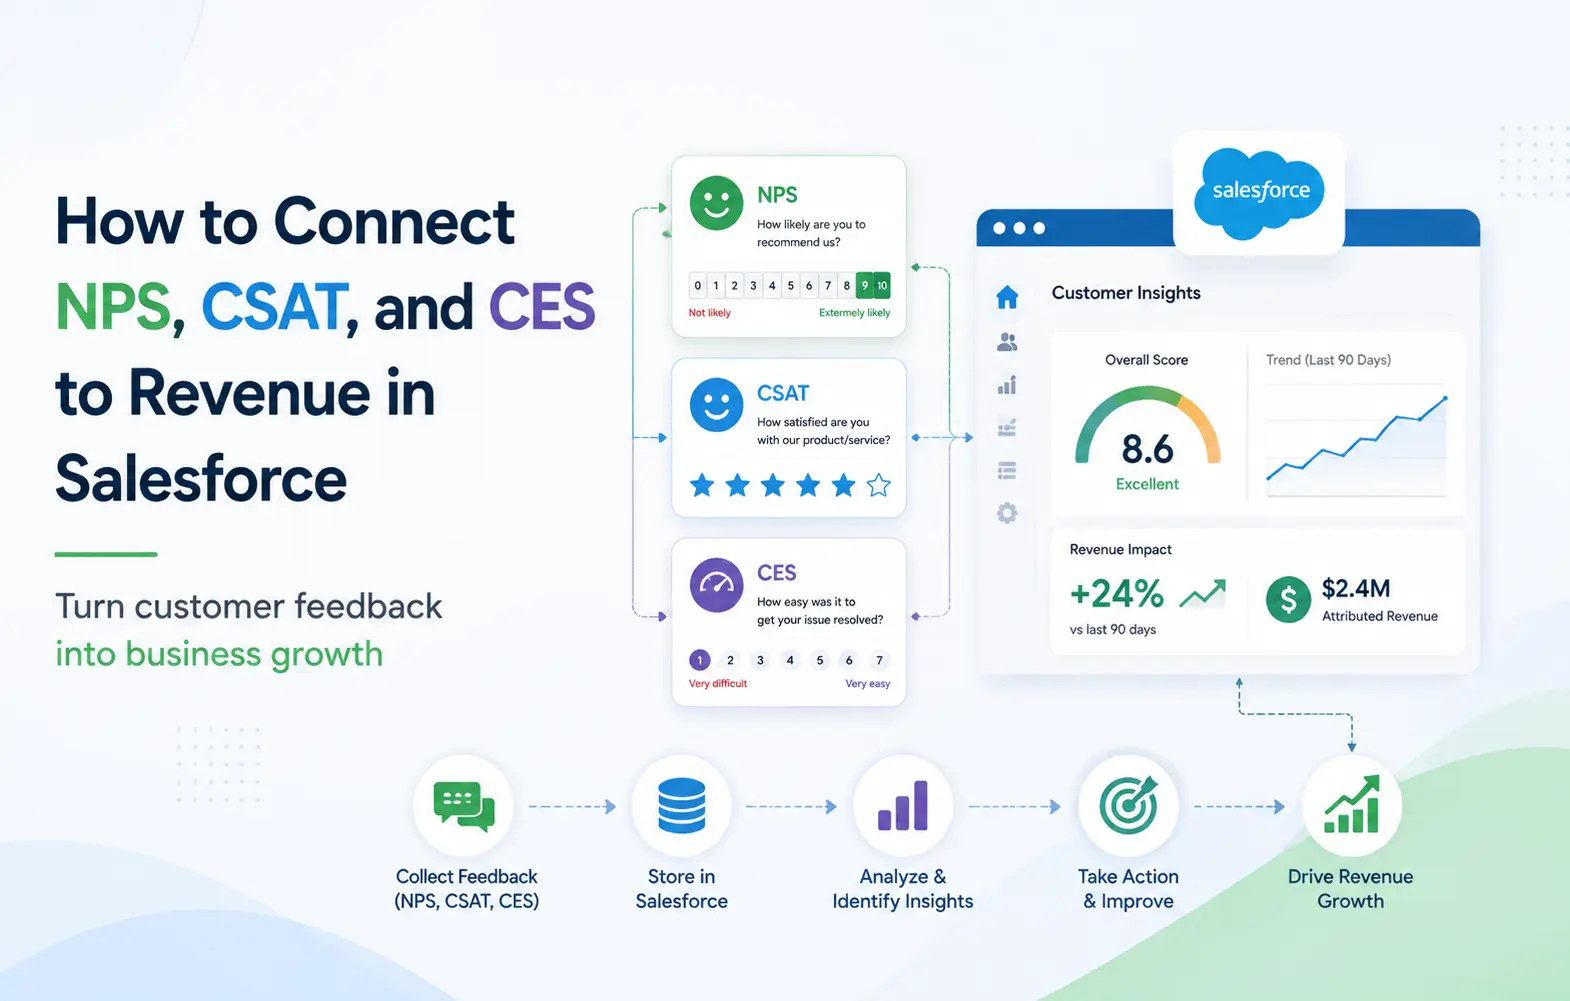
NPS Salesforce data only becomes useful once it touches a dollar figure. A score sitting alone on a Contact record tells you almost nothing. The moment you link that score to Opportunity Amount, the story changes. This guide walks through exactly how that connection gets built.
Most teams collect NPS, CSAT, and CES scores for months. Few ever connect those scores to actual revenue outcomes. That gap is no longer a technology problem. It is usually a reporting problem, solvable inside Salesforce itself.
What NPS, CSAT, and CES Actually Measure
Customer experience metrics fall into three fairly distinct categories. Each one answers a different question about the relationship.
NPS Salesforce programs track loyalty using one simple recommendation question. Customers score zero to ten, then get grouped by response. Promoters score nine or ten and drive strong referrals. Detractors score zero through six and signal real churn risk.
This short video below breaks down how NPS scoring works natively inside Salesforce.
[Embed: https://surveyvista.com/resources/videos/surveyvista-net-promoter-score-nps-in-a-nutshell/]
CSAT Salesforce surveys measure satisfaction after one specific interaction. A support case closes, then CSAT asks how that felt. It is transactional, fast to collect, and tightly scoped. SurveyVista’s own CSAT Salesforce integration guide covers this setup in more depth.
CES Salesforce surveys measure something different: effort, not satisfaction. How hard was it to get help or complete a task? Lower effort scores consistently predict stronger loyalty over time.
Why NPS Salesforce Data Predicts Revenue, Not Just Sentiment
This connection is not just marketing theory or wishful thinking. Bain & Company, which created the NPS methodology, studied this link directly. Their research found that industry NPS leaders grow much faster than rivals. On average, leaders grow more than twice as fast as competitors. Across most industries studied, NPS explained a wide range of growth differences. That range spans roughly twenty to sixty percent of variation.
Salesforce customer satisfaction data only predicts revenue in the right context. That context means placing both scores near the same revenue record. Two records living in separate systems cannot tell that story together.
One SurveyVista case study shows this pattern playing out in practice.
Where These Scores Should Live in Salesforce
Survey scores belong on the record tied to that relationship. They should never float alone, disconnected from any account. NPS typically lives on Contact, then rolls up to Account level. CSAT ties to the specific Case or interaction it followed. CES attaches wherever that effortful task actually took place.
Revenue data lives somewhere else entirely: the Opportunity object. Amount, Stage, and Close Date all sit there by default. Connecting customer feedback and Salesforce data to revenue means joining objects. Those objects sit separately unless a report links them.
One SurveyVista case study illustrates this pattern in practice. A global interim leadership firm faced inconsistent customer expectations across placements. They deployed native NPS and CSAT surveys directly inside Salesforce. Every response mapped instantly to the right account and contact. That real-time mapping lets their team spot satisfaction gaps immediately. The result was stronger customer relationships and measurable brand advocacy.
Step-by-Step: Building a Revenue Report from Feedback Scores
Here is exactly how that report gets built, step by step.
- Confirm your survey tool writes scores to Salesforce records. If scores sit in an external platform, this report becomes harder. You would need extra export or sync work first.
- Identify the shared object connecting feedback data and revenue. Usually that shared object is the Account record itself. Both Contacts and Opportunities relate back to that Account.
- Build a joined report that combines both data sources. Salesforce’s own documentation on joined reports explains exactly how these combine cleanly.
- Add the Opportunity Amount field as your revenue column. The Opportunity object stores this field by default, ready to reference.
- Group results by NPS category, not the raw score. Promoter, Passive, and Detractor segments reveal patterns individual scores hide completely.
- Filter Opportunities so only closed-won deals appear in results. Comparing scores against pipeline, not booked revenue, misleads easily.
- Add a dashboard component to track this trend over time. A single report answers today’s question about current performance. A dashboard instead tracks that pattern across many months.
NPS vs CSAT vs CES: What Each One Signals About Revenue
| Metric | What it predicts | Revenue signal type |
| NPS | Renewal likelihood, expansion, referrals | Relationship-level, long-term |
| CSAT | Immediate churn risk after service | Transaction-level, short-term |
| CES | Retention risk from friction and effort | Process-level, leading indicator |
Common Mistakes When Linking Feedback Scores to Revenue
Comparing scores across the wrong time window causes real problems. A 90-day-old NPS score tells you almost nothing useful. Match survey timing to the revenue event you analyze.
Averaging scores instead of segmenting them hides real patterns. A flat average NPS of thirty hides a critical split. Ten Promoters and ten Detractors average very differently than Passives.
Ignoring sample size on smaller accounts skews the picture. One angry customer skews a small account’s satisfaction score badly. Weight your analysis accordingly, especially for smaller enterprise segments.
Building this once, then never revisiting it wastes the effort. Customer sentiment shifts quarter over quarter, sometimes even faster. A report built once in January often goes stale.
Why Native Data Makes This Connection Possible
SurveyVista does not offer one packaged revenue correlation dashboard. What it does provide instead is simpler, and arguably better. Every score maps automatically to Contacts, Accounts, and Cases.
The video below covers turning raw survey data into real action.
Because that data already lives inside Salesforce, standard reports work immediately. No export step, no API sync, no overnight waiting required. You build the joined report above using your own live data.
If you’re exploring Salesforce survey tools, SurveyVista’s platform fits well. It removes the sync delay between feedback and revenue entirely. Learn more on the SurveyVista platform overview page. You can also compare NPS directly against CSAT before starting.
Frequently Asked Questions
Do I need a special app to connect NPS scores to revenue?
No, standard Salesforce reports and dashboards handle this connection fine. What matters most is keeping both data sets inside Salesforce. Scattered platforms require manual export work before any comparison happens.
How often should I refresh this revenue correlation report?
Monthly works well for most B2B teams tracking account health. High-velocity businesses with shorter sales cycles may prefer weekly refreshes.
Should I use NPS or CSAT to predict churn risk?
NPS predicts longer-term relationship health better than CSAT does. CSAT catches immediate, transaction-level dissatisfaction faster than NPS can. Both metrics work best when used together, not alone.
What’s a good sample size before trusting this correlation?
Larger accounts with more respondents produce more reliable correlations. Treat single-digit response counts very cautiously in any segment.
Can this same approach work for CES instead of NPS?
Yes, the same joined-report approach applies to CES equally. Just substitute your CES field for NPS in the report.
More Like This




Rajesh Unadkat 
Founder and CEO
Rajesh is the visionary leader at the helm of SurveyVista. With a profound vision for the transformative potential of survey solutions, he founded the company in 2020. Rajesh's unwavering commitment to harnessing the power of data-driven insights has led to SurveyVista's rapid evolution as an industry leader.
Connect with Rajesh on LinkedIn to stay updated on the latest insights into the world of survey solutions for customer and employee experience management.