Cat Ownership & Customer Feedback Programs: Correlation or Causation


Over the last four posts, we’ve covered dashboards that don’t decide, programs missing their doing wing, flying on a single dial, and feedback data with too few dots to trust. This week: the trap that catches teams even when they’ve done everything else right.
Here’s a great story to convey my point.
Early in their career, one of my trusted advisors was working with a UK telecoms provider, They found something odd buried in its data: customers who owned cats made noticeably more phone calls than customers who didn’t. Statistically, the relationship was real. Someone in the room, only half joking, suggested a cat-owner calling plan.
Nobody built the calling plan, thankfully, because the correlation was real and the causation was almost certainly nonsense. Cats don’t make people phone more. But the kind of person who owns a cat may simply also be the kind of person who makes more calls, for reasons that have nothing to do with the cat at all. Two things moving together doesn’t mean one is driving the other. Both might be driven by a third thing neither of them mention.
This should be obvious and is, when the example is cats. It’s a lot less obvious when the correlation reinforces a story you already believe.
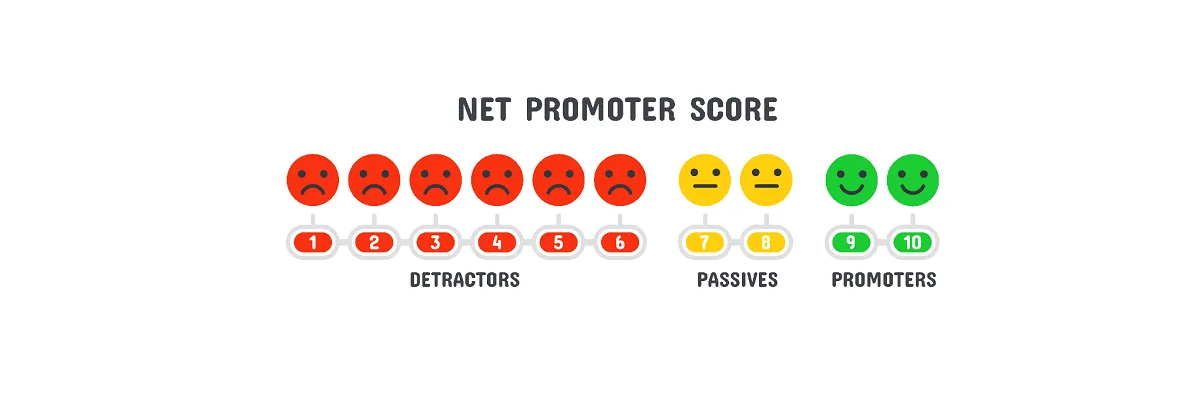
Feedback data is a magnet for spurious correlation because it’s so easy to slice. Segment by enough variables and you will find something that correlates with loyalty, with NPS, with anything you like. This may be purely by chance, or because both are downstream of a factor you haven’t considered. Customers who use a particular feature score higher on NPS. Great, roll it out to everyone? Maybe. Or maybe the customers who already loved you were the ones who bothered to explore the feature in the first place, and pushing it on everyone else changes nothing.
The commercial cost of mistaking correlation for causation isn’t abstract. Chase the wrong driver, and you invest budget, time, and change management effort into something that was never going to move the number, while the real cause sits untouched. Worse, you often can’t tell it didn’t work, because something else was moving in the background anyway, and you credit your fix for a change it didn’t cause.
Getting from correlation to something closer to causation isn’t difficult. A few disciplines help:
None of this matters if you’re finding drivers of the wrong outcome. A huge amount of feedback analysis stops at finding drivers of NPS or CSAT, as if moving the score were the goal. It isn’t. The score is a proxy, and proxies can be gamed, misread, or moved for reasons that are unrelated to the business doing better.
The outcome that matters is profitable growth: retention, expansion, reduced cost to serve, advocacy that generates new revenue. Start the driver analysis there, not at the survey score. A driver of NPS that doesn’t touch any of those things may be interesting, but it isn’t a priority. A driver of NPS that also reduces churn and support costs is worth real investment. The second kind is rarer, more valuable, and much easier to find if you’re looking for it directly rather than assuming NPS is the outcome rather than the messenger.
This is where correlation-chasing does its quiet damage. Under pressure to move a score, teams often reach for actions that improve the metric without helping the business, or that help the business at the customer’s expense. They may nudge a number but make no impact on the bottom line.
The drivers worth chasing are the ones that satisfy “and,” not “or”: good for the customer and good for the company. Proactively fixing a fault before it causes three more support calls helps the customer and cuts cost to serve. Making onboarding genuinely simpler helps the customer and improves activation and retention. These are rarer to find than a spurious correlation, but they’re the only kind of driver worth building a program around, because they’re the only kind that drive the P&L.
Dave and I still think about that cat-owner chart story occasionally, because the instinct that produced it hasn’t gone away; it’s just got better tools. Modern feedback platforms can slice a dataset a thousand ways in seconds and surface every correlation, real or not, in a tidy dashboard. That’s a feature until it’s treated as a shortcut to real thinking. A machine that finds patterns faster than a human doesn’t make those patterns any more causal. It just makes it faster to build a confident-looking case for the wrong action.
Next time a pattern in your feedback data looks like an answer, ask the cat-owner question. Is there a plausible reason one thing would cause the other, or have you just found two things that happen to move together? Would it survive a test, or only a glance at a dashboard? And critically, is it a driver of the score, or a driver of the business?
Correlation will always be easier to find than causation. It’s also nearly worthless on its own. Chase the driver, not the coincidence, and make sure whatever you find is good for the customer and the company, not one at the other’s expense.
PS, if you like spurious correlations, check out Tyler Viglen’s hilarious collection. My favorite is the almost perfect correlation between butter consumption and ticket prices at North American movie theaters. Let me know your favorite!
Chasing the right driver still assumes you know what decision you’re trying to inform before you start collecting data. Next week, in the final post of this series, we turn the telescope all the way around – starting with the action, not the survey.


Rajesh is the visionary leader at the helm of SurveyVista. With a profound vision for the transformative potential of survey solutions, he founded the company in 2020. Rajesh's unwavering commitment to harnessing the power of data-driven insights has led to SurveyVista's rapid evolution as an industry leader.
Connect with Rajesh on LinkedIn to stay updated on the latest insights into the world of survey solutions for customer and employee experience management.