
share: 


Customer satisfaction scores aren’t just numbers on a dashboard—they’re the pulse of your business. A 75% CSAT score might be fantastic in banking while being mediocre in consulting.
Understanding where you stand compared to industry peers makes the difference between celebrating success and missing opportunities. When you’re tracking UX KPIs like CSAT scores, context becomes everything.
What is CSAT Benchmarking?
CSAT benchmarking is comparing your customer satisfaction scores against industry standards or competitors to see where you stand.
Think of benchmarks as your industry report card. They show you what’s possible, what’s expected, and where you have room to grow.
Why is Customer Satisfaction Benchmarking Important?
Customer satisfaction benchmarking matters because it transforms CSAT from a vanity metric into actionable intelligence. You’re not just tracking scores—you’re spotting competitive gaps before they cost you customers.
How to Calculate CSAT?
CSAT calculation isn’t rocket science, but choosing the right method makes the difference between vanity metrics and actionable intelligence. Most teams default to one approach without realizing they’re missing critical insights.
Here’s what matters: pick a method that matches your business model and stick with it for consistency.
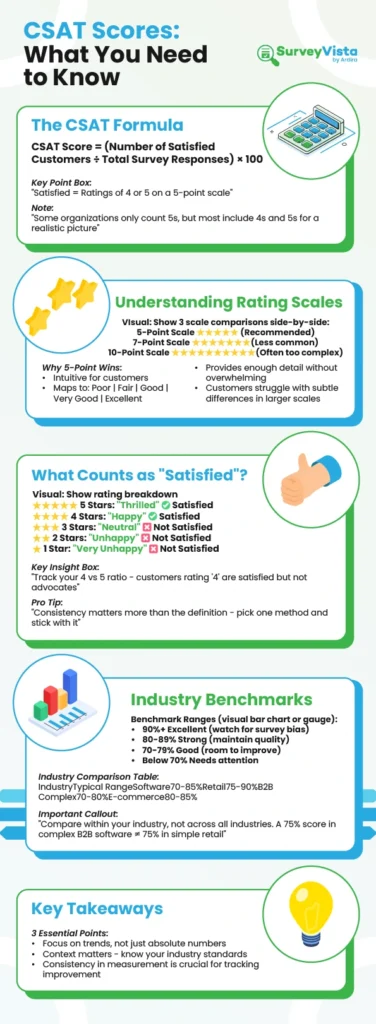
Method 1: Percentage of Satisfied Customers (Most Common)
Formula: (Number of satisfied responses ÷ Total responses) × 100
This is the gold standard for CSAT. Ask customers to rate their satisfaction on a 5-point scale. Count scores of 4-5 as “satisfied,” ignore the rest.
Example: You send 1,000 post-support surveys. 600 respond. 480 rate you 4 or 5.
Calculation: (480 ÷ 600) × 100 = 80% CSAT
Why this works: It’s binary—customers are either satisfied or they’re not. No middle ground to muddy your analysis.
Method 2: Average Score Method
Formula: Sum of all scores ÷ Number of responses
Better for granular analysis when you need to track incremental improvements. Every decimal point matters when you’re optimizing touchpoints.
Example: 100 customers respond on a 5-point scale.
Scores: 20 ones, 10 twos, 15 threes, 25 fours, 30 fives
Calculation: (20×1 + 10×2 + 15×3 + 25×4 + 30×5) ÷ 100 = 3.35 average
This method reveals distribution patterns the percentage method hides. A 3.35 average with most scores at extremes tells a different story than 3.35 with everyone rating you “3”.
What’s the Best Customer Satisfaction Metric? CSAT vs. NPS vs. CES
Not all satisfaction metrics are created equal—each tells a different story about your customer relationships.
Let’s cut through the confusion and show you exactly when to deploy each metric.
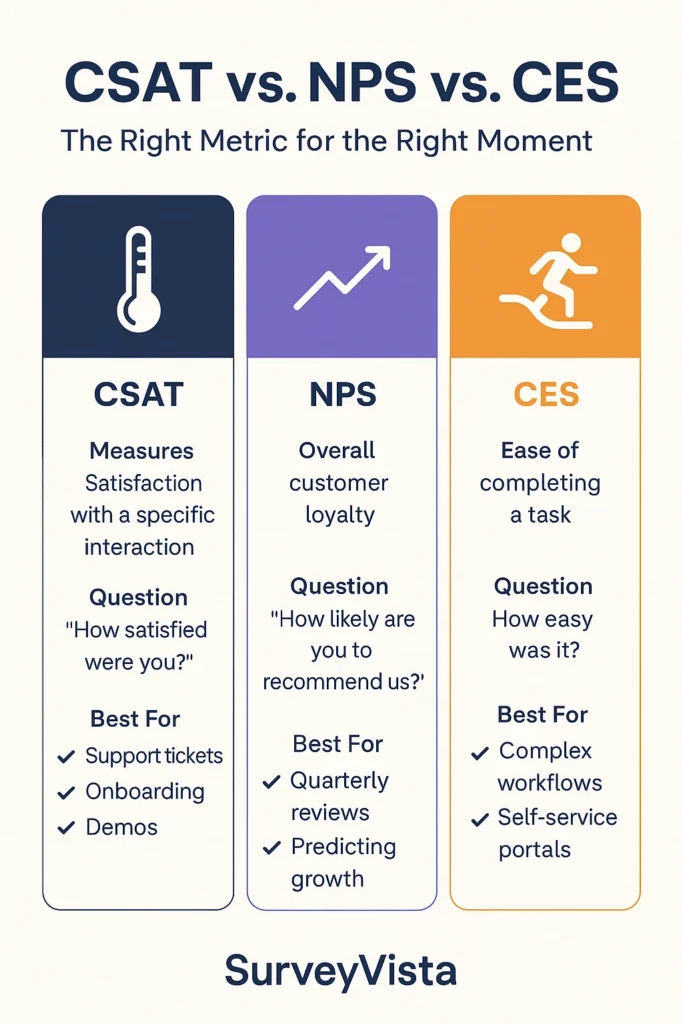
CSAT (Customer Satisfaction Score)
What it measures: Satisfaction with a specific interaction or touchpoint.
Question: “How satisfied were you with [specific experience]?”
Scale: Typically 1-5 or 1-10
When to use: After support tickets, onboarding, product demos, or any discrete interaction.
CSAT is your real-time thermometer. It catches problems while they’re fresh and fixable. Perfect for operational improvements and team performance tracking.
Example: Your support team closes 500 tickets weekly. CSAT tells you if those resolutions actually satisfied customers or just closed cases.
NPS (Net Promoter Score)
What it measures: Overall loyalty and likelihood to recommend.
Question: “How likely are you to recommend us to a friend or colleague?”
Scale: 0-10 (Detractors: 0-6, Passives: 7-8, Promoters: 9-10)
When to use: Quarterly relationship checks, post-purchase, renewal discussions.
NPS predicts growth. Promoters buy more, stay longer, and bring friends. Detractors churn and warn others away.
Example: Your quarterly NPS is 45. Great, but segment it—enterprise customers at 60, SMBs at 20. Now you know where to focus.
CES (Customer Effort Score)
What it measures: How easy or difficult it was to complete a task.
Question: “How easy was it to [complete specific action]?”
Scale: 1-7 (Very Difficult to Very Easy)
When to use: After complex processes like implementations, integrations, or multi-step workflows.
CES predicts churn better than satisfaction. High-effort experiences kill loyalty, even when customers get what they need.
Example: Your onboarding CES is 3.2. Customers struggle to get started—fix this before measuring satisfaction.
Which Metric When? The Strategic Framework
Use CSAT for:
- Support ticket resolution
- Feature releases
- Training sessions
- Individual touchpoint optimization
- Team performance metrics
Use NPS for:
- Quarterly business reviews
- Account health scoring
- Renewal predictions
- Referral program targeting
- Company-wide KPIs
Use CES for:
- Onboarding workflows
- Self-service portals
- Product adoption paths
- Process simplification
- Digital transformation initiatives
How Do You Design a CSAT Survey?
Most CSAT surveys fail before the first question—killed by complexity, length, or poor timing.
Great surveys feel effortless to complete yet deliver rich insights. Here’s how to build them.
1. Respect the 30-Second Rule
Customers spend 75 seconds on single-question surveys but only 30 seconds per question when you add more. The math is clear—every additional question costs you accuracy and participation.
Keep your core CSAT survey under 5 questions.
What works: “How satisfied were you with today’s support call?”
What doesn’t: “Please evaluate your satisfaction with our multi-channel support ecosystem’s responsiveness metrics.”
2. Target the Moment, Not the Universe
Long surveys trigger the “straight-line syndrome”—respondents clicking the same rating repeatedly just to finish. You get data, but it’s worthless.
Map your critical touchpoints first. Support ticket closed? One question about resolution quality. Product demo completed? Focus on presenter clarity. Purchase finalized? Ask about checkout ease.
3. Pick One Scale and Stick With It
Mixing 5-point satisfaction scales with 10-point effort scores confuses customers and corrupts data. Your brain can’t compare a “4 out of 5” with a “7 out of 10” accurately—neither can your customers.
Choose your weapon:
- 5-point scale: Simple, mobile-friendly, highest completion rates
- 10-point scale: More granular but lower response rates
- Emoji scale: Great for quick pulse checks, terrible for trending
4. Always Include the Escape Hatch
Nothing frustrates customers more than forced irrelevance. That question about shipping experience? Meaningless to your digital-only customers.
Add “Not Applicable” or “No Experience” options to every question that might not apply universally. It’s better to skip data than collect false data.
5. Make Comments Optional, Not Obligatory
Mandatory text fields are satisfaction killers. Happy customers forced to write become annoyed customers. Angry customers forced to explain become ex-customers.
Here’s what actually works:
- Required: Your core CSAT rating (one click)
- Optional: “Tell us more” (for the passionate)
- Smart: Conditional comments (low scores trigger “What went wrong?”)
The passionate 20% will write novels. The satisfied 60% will click and move on. The angry 20% will vent if they want to—or rage-quit if forced.
What Types of Questions to Ask on a CSAT Survey?
Question 1: The Core CSAT
“How satisfied were you with [specific interaction]?”
Use a 5-point scale with clear labels. No ambiguity.
Question 2: The Why
“What’s the main reason for your score?”
Open text, optional. This is where gold hides—actual problems in their words.
Question 3: The Specific
Target the variable you’re testing.
- For support: “How knowledgeable was your agent?”
- For onboarding: “How clear were the setup instructions?”
- For product: “How well did [feature] meet your needs?”
Question 4: The Follow-Up (Conditional)
If dissatisfied: “What could we have done better?”
If satisfied: “What did we do well?”
Question 5: The Permission
“May we contact you about your feedback?”
Creates a rescue path for unhappy customers.
Scale Selection Best Practices
5-Point Scale (Recommended)
- Very Dissatisfied | Dissatisfied | Neutral | Satisfied | Very Satisfied
- Clear mental model, higher completion
- Mobile-friendly (fits on one screen)
Avoid These Scale Mistakes:
- Mixing number and text scales
- Using different scales across touchpoints
- All-positive labels (skews results)
- Even-numbered scales without a neutral option
Channel-Specific Optimization
Email Surveys
- Embed first question in email body
- One-click responses increase participation 40%
- Brand consistently with your emails
In-App Surveys
- Trigger after task completion, not mid-flow
- Slide-in widgets beat modal popups
- Allow dismissal without penalty
SMS Surveys
- Single question only
- Use number responses (Reply 1-5)
- Follow up via email if more detail needed
Web Intercepts
- Exit-intent timing works best
- Keep on-brand with your site design
- Never block content access
Advanced Design Techniques
Dynamic Personalization
Pull context from Salesforce: agent name, product purchased, ticket number. “How satisfied were you with John’s resolution of ticket #4521?” beats generic questions.
Smart Branching Logic
Don’t waste questions. Dissatisfied customers get improvement questions. Satisfied customers get referral requests.
Response Validation
Require scores but make comments optional. Force choice on scales but allow “Not Applicable” where relevant.
Timing Strategies That Maximize Response
Support Interactions: Within 4 hours of case closure
Product Onboarding: Day 7 and Day 30
Purchase Decisions: 24-48 hours post-transaction
Feature Adoption: After 3rd use of new feature
Renewal Conversations: 90 days before contract end
What are the CSAT Industry Benchmarks?
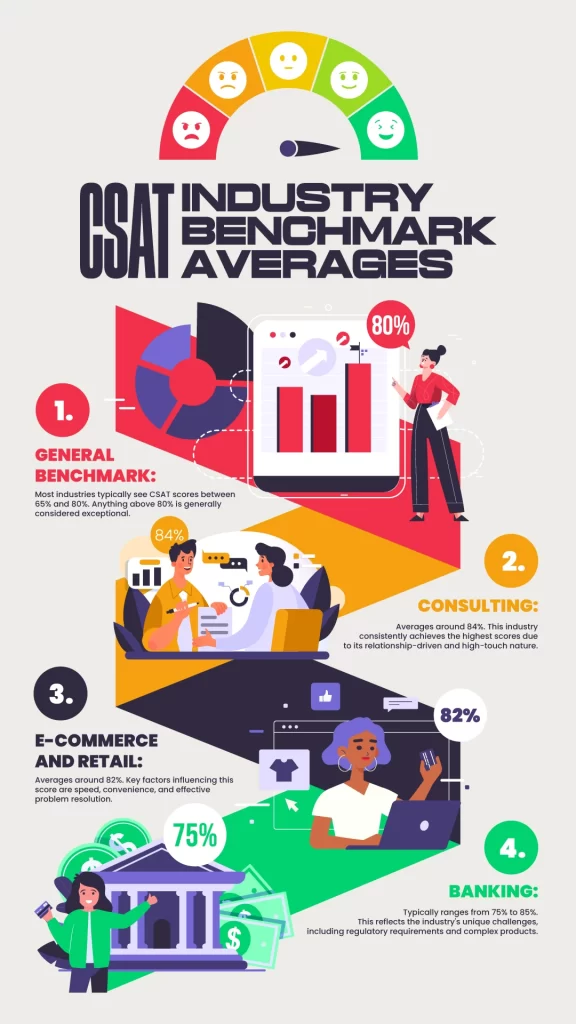
Real benchmarks come from real data, not wishful thinking. These aren’t theoretical targets—they’re based on actual performance data from companies measuring customer satisfaction across various touchpoints.
Consulting Leads the Pack at 84%
Consulting firms consistently achieve the highest CSAT scores across industries, averaging around 84%. This makes sense when you consider the relationship-driven nature of consulting work.
Consultants typically work closely with clients over extended periods, building trust and understanding specific business needs. The high-touch, personalized approach naturally leads to higher satisfaction scores.
But don’t let this benchmark intimidate you if you’re in consulting—it also means your customers expect exceptional service as the baseline.
E-commerce and Retail Hit 82% on Average
E-commerce and retail businesses average around 82% CSAT, though this varies significantly based on product category and customer segment. Fashion and lifestyle brands often score higher than electronics or home goods.
The key drivers here are speed, convenience, and problem resolution. Customers expect fast shipping, easy returns, and responsive support when issues arise.
Mobile optimization alone can boost e-commerce CSAT scores by 12-15%, making it one of the highest-impact improvements you can make.
Banking Targets 75-85% Despite Complex Challenges
Banking CSAT scores typically range from 75-85%, reflecting the unique challenges financial institutions face. Regulatory requirements, security protocols, and complex products create natural friction points.
The most successful banks focus on reducing customer effort rather than just increasing satisfaction. When customers can complete transactions quickly and easily, satisfaction follows naturally.
Post-transaction surveys work particularly well in banking, capturing feedback when the experience is fresh in customers’ minds.
How Regional Differences Impact Your Scores
Geography plays a bigger role in CSAT than most companies realize. North American customers tend to rate experiences more positively than European customers, even for identical service levels.
Cultural factors influence how people respond to satisfaction surveys. Some cultures are naturally more critical, while others lean toward positive responses.
This means global companies need region-specific benchmarks rather than universal targets. What looks like underperformance in one market might actually represent strong results when cultural context is considered.
How to Achieve Customer Success in Different Industries?
Understanding the levers that move satisfaction scores in your industry helps you focus improvement efforts where they’ll have the biggest impact. Different sectors have different pressure points.
The factors that delight customers in e-commerce might be table stakes in consulting, while banking customers care about things that barely register in retail.
E-commerce Success Factors
E-commerce CSAT lives and dies on execution fundamentals. Customers have clear expectations, and meeting them consistently drives satisfaction more than flashy features.
- Mobile optimization impact: Companies with mobile-optimized experiences see 12-15% higher CSAT scores
- Delivery speed effects: Same-day or next-day delivery can improve CSAT by up to 20%
- Return policy influence: Hassle-free returns boost satisfaction scores by roughly 18%
- Personalization benefits: Tailored product recommendations lift CSAT scores by 10-15%
Banking-Specific CSAT Drivers
Banking satisfaction hinges on trust, efficiency, and problem resolution. Customers want their financial interactions to be smooth, secure, and straightforward.
Post-transaction survey timing matters enormously in banking. Capture feedback immediately after account openings, loan approvals, or support interactions when the experience is still fresh.
Omnichannel experience consistency drives satisfaction more than individual channel performance. Customers expect seamless transitions between online, mobile, and branch interactions.
Digital vs. in-person service balance requires careful calibration. Some customers prefer digital efficiency, while others value human interaction for complex financial decisions.
Universal CSAT Improvement Factors
Certain satisfaction drivers work across industries, regardless of your specific business model. These universal factors form the foundation of any solid customer experience strategy.
Response time consistently impacts satisfaction across all sectors. Problem resolution effectiveness matters everywhere—how well you fix issues when they arise often determines satisfaction more than preventing problems in the first place.
Common CSAT Measurement Methods
The way you ask the question shapes the answer you get. Different measurement approaches work better for different business models and customer types.
Your choice of measurement method should align with your customer base, industry norms, and internal reporting needs. Designing effective customer satisfaction surveys requires understanding these methodological differences.
Numeric Rating Scales (1-5 or 1-10)
Numeric scales give you granular data and easy-to-understand averages. Most customers are comfortable with rating scales, making them a safe choice for broad audiences.
The 1-5 scale works well for quick feedback, while 1-10 scales provide more nuance for detailed satisfaction measurement. Some customers avoid extreme ratings, clustering around the middle, while others gravitate toward the ends of the scale.
Happy-Neutral-Unhappy Emoticon Systems
Emoticon-based surveys reduce cultural bias and work well across language barriers. The visual nature makes them particularly effective for mobile surveys.
These systems typically see higher response rates than numeric scales because they’re faster and more intuitive to complete. The trade-off is less granular data, but for many use cases, knowing whether customers are happy or unhappy is sufficient.
Simple Thumbs Up/Thumbs Down Approaches
Binary feedback systems work brilliantly for quick pulse checks and high-volume touchpoints. They’re perfect for post-purchase emails or in-app feedback requests.
The simplicity drives high response rates, and the data is easy to act on. This approach works particularly well for digital services where you need frequent feedback without survey fatigue.
Which Method Works Best for Your Business
Your ideal measurement method depends on your customer base, feedback frequency, and decision-making needs. High-touch B2B relationships might benefit from detailed numeric scales.
High-volume B2C businesses often get better results with simple emoticon or binary systems that don’t create survey fatigue. Consider testing different approaches with small customer segments before rolling out company-wide changes.
What Is a Good CSAT Score?
A perfect 100% CSAT usually means you’re measuring too few customers or only hearing from your happiest ones. Real businesses with real volume land between 70-85%, and that’s exactly where they should be.
Anything above 60% means more customers leave satisfied than frustrated. Hit 70%, and you’re in healthy territory. Break 80%, and you’re outperforming most competitors.
Frequently Asked Questions
What is a good CSAT score for my industry?
CSAT scores vary significantly by industry. Consulting leads at 84%, e-commerce averages 82%, and banking ranges from 75-85%. Focus on outperforming your direct competitors rather than comparing across different industries, as each sector has unique customer expectations and friction points.
How often should I survey customers for CSAT feedback?
Survey customers immediately after key interactions like purchases, support resolutions, or deliveries when experiences are fresh. Avoid survey fatigue by spacing requests appropriately and using automated triggers to prevent multiple surveys to the same customer within short timeframes.
Should I use a 1-5 scale or emoticons for CSAT surveys?
Choose based on your audience and goals. Numeric scales (1-5 or 1-10) provide granular data for detailed analysis. Emoticons work better for mobile surveys and reduce cultural bias. Simple thumbs up/down approaches drive highest response rates for quick feedback.
How do I improve low CSAT scores in my industry?
Focus on your industry’s specific satisfaction drivers. E-commerce should prioritize mobile optimization and delivery speed. Banking should reduce customer effort and improve problem resolution. Start with 3-5 point improvements rather than unrealistic targets that discourage teams.
Can I compare my CSAT scores directly with competitors?
Direct score comparisons are unreliable due to different survey designs, timing, and methodologies. Focus on trends and relative performance instead. Use industry benchmarks as context for your performance rather than exact targets to match or beat.
More Like This


Rajesh Unadkat 
Founder and CEO
Rajesh is the visionary leader at the helm of SurveyVista. With a profound vision for the transformative potential of survey solutions, he founded the company in 2020. Rajesh's unwavering commitment to harnessing the power of data-driven insights has led to SurveyVista's rapid evolution as an industry leader.
Connect with Rajesh on LinkedIn to stay updated on the latest insights into the world of survey solutions for customer and employee experience management.